NRW State Culture Report: Cultural Statistics and Data Visualisation
For the NRW State Culture Report, the Cultural Policy Lab is working on the chapter on the economic and social situation of cultural workers. The project combines secondary data analysis, original visualisations in R and cultural policy interpretation — making complex findings usable for ministerial decision-making and the broader cultural policy discourse.
The Challenge
The economic and social situation of cultural workers is highly relevant for cultural policy, yet statistically difficult to access. Data are often scattered across different sources, classifications and levels of aggregation, making them hard to prepare in ways that are equally useful for ministerial decision-making, political coordination and public reporting. That was the central challenge: not merely to gather data, but to analyse and visualise them in a way that provides solid orientation in the specific context of North Rhine-Westphalia.
Our Approach
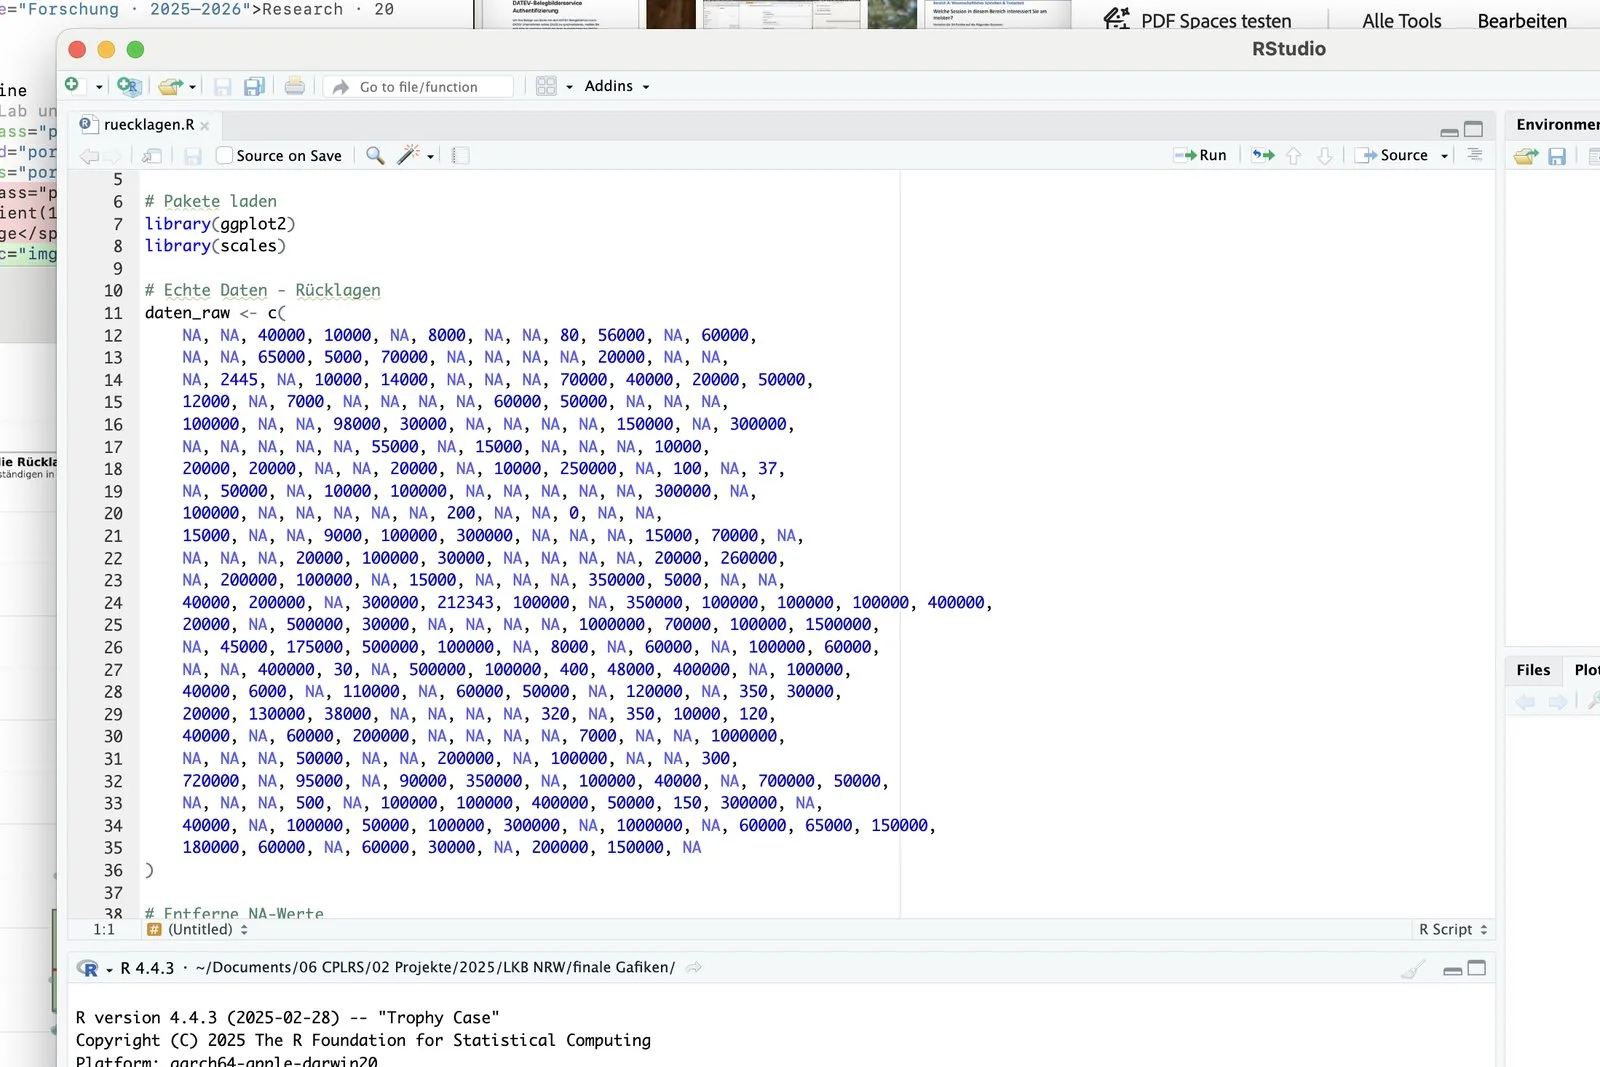
Our approach was to closely connect analytical expertise, data visualisation and cultural policy experience. To do so, we worked intensively with the NRW State Culture Report 2022, reviewed existing reporting logics and asked which kinds of information are actually useful for the ministry in the current political context. This was not only about statistical precision, but also about compatibility with ministerial workflows, federal coordination processes and the wider cultural policy discourse. A key element was the use of official secondary data, including income tax and turnover tax data. These data were not treated in isolation, but translated into forms that make differences, ranges and structural problem patterns more visible. In this respect, visualisation was not understood as an afterthought, but as an analytical tool in its own right.
The Solution
For the chapter on the economic and social situation of cultural workers, the Cultural Policy Lab developed a targeted combination of secondary data analysis and innovative visualisation. We worked with the statistical software R and created original charts designed to make complex distributions and differences more understandable. This included the use of boxplot diagrams — a format still rarely used in cultural statistics, but especially helpful for questions of income and distribution because it offers a more precise view of ranges, outliers and structural inequalities. The result was a mode of data preparation that does not merely illustrate findings, but sharpens them analytically. The visualisations were deliberately designed to be both methodologically robust and readable in ministerial and cultural policy contexts. This reflects our understanding of data storytelling in cultural policy: preparing data in ways that better support decisions, debates and strategic priorities.
Impact & Transfer
This project shows how cultural policy, statistics and strategic communication can be productively linked. For the ministry, this means more readable, politically usable and analytically robust foundations for a central topic of the State Culture Report. For us as the Cultural Policy Lab, the project marks an important step because it allowed us to combine our cultural policy experience with innovation in data analysis and visual communication. This is where we see our role: introducing new tools and representational formats into a field that depends on robust data, but still has considerable potential in the way these data are prepared. Where traditional tables quickly reach their limits, thoughtful visualisation can make differences visible, structure debates and help develop cultural policy as a learning, data-informed field.